The Mac slowdown doctor

Mac slow again?
See which app did it, inspect it in one click.

MacPulse tells you in plain words why your Mac is slow and which app caused it — then lets you switch to it or reveal it in Finder. No graphs or process tables to decode.

Monitoring free forever · 7-day Pro trial · Runs locally, uploads nothing · Apple Silicon · macOS 13+
v1.0.0 · build 150
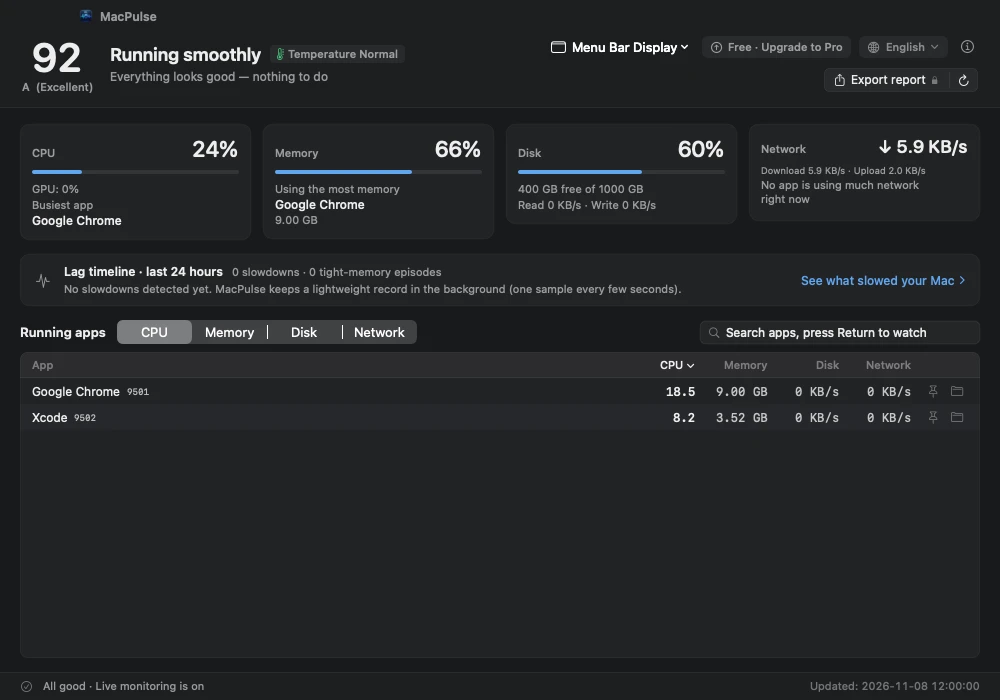
MacPulse main window: health score, CPU, memory and disk usage, lag timeline and one-click actions
App screenshot with sample data
Runs on your MacNo account neededNo ads, no trackingAsks before acting

Your Mac is slow — but which app is to blame?

Activity Monitor shows hundreds of processes and a wall of numbers, and by the time you open it the slowdown is often over. Browsers and chat apps run dozens of helper processes scattered across the list, so it is hard to tell which app is really using the resources.

MacPulse takes a lightweight sample every few seconds. The moment a slowdown happens, it groups helper processes back into their app and records it in one sentence:

14:32 Slowdown: Google Chrome using 9.8 GB in total, memory pressure turned red, macOS started using the disk as memory

Example (translated) of the messages the app records

Lag timeline · last 24 hours
14:32 Sustained high CPU · Cause: a video editing app · [Switch to App] [Reveal in Finder]
16:05 Memory pressure turned yellow · Cause: browser (incl. 23 helper processes) · [Switch to App] [Reveal in Finder]

Illustration, not a screenshot

Understand it at a glance, inspect in one click

Health scoreFree

A 0–100 score computed live from CPU, memory pressure, swap and free disk space, with the weakest area named in one sentence.

Menu barFree

Live CPU usage in the menu bar; click it for the health score and an overview without keeping the main window open.

Top processesFree

Process lists sorted by CPU or memory, refreshed live.

Long-range lag timelinePro

Records sustained high CPU, memory pressure spikes and swap surges, groups helper processes into their app, pinpoints root causes, and lets you switch to the app or reveal it in Finder. Choose 24 hours, 7/30/90/365 days, all recorded history or custom dates. Export the selected range; recording gaps stay visible.

App Family tree groupingPro

Recursively rolls up dozens of browser and framework helper processes into their main app, showing aggregated CPU, memory, and energy at a glance.

Menu bar customizationPro

Choose which metrics to show in your menu bar (CPU, memory, disk, network) and customize capsule styles to fit your workflow.

One-click app switch & Finder revealPro

Instantly switch to the lag-causing application window or reveal its executable bundle directly in Finder for safe inspection.

HTML health reportPro

Exports an offline HTML report with the score and details to your Desktop, easy to keep or share.
How it works

  1. See

    The menu bar and health score show how your Mac is doing right now, and which area is under strain.

  2. Find

    Slowdowns are recorded automatically; the timeline says which app was responsible and how much it used.

  3. Inspect

    Switch to the responsible app or reveal it in Finder to investigate — keep full control with zero risky system operations.

How the health score works

The score is a factual summary of the current load. It is recalculated every 3 seconds from measured values while MacPulse is open, and capped when any single area is clearly strained, so one weak area is never hidden by a high total.

Grades: A ≥ 90 · B ≥ 75 · C ≥ 60 · D ≥ 40 · F < 40. A low score only means your Mac is busy right now; quitting a heavy app or restarting usually brings it back.

AreaWeightBased on
CPU25%Live usage and 1-minute load
Memory pressure35%Pressure level reported by macOS
Swap20%Swap used relative to physical memory
Free disk space20%Share and amount of free space

Free vs Pro

Monitoring is free forever. The first launch includes a 7-day Pro trial with no payment details required; free features keep working after it ends.

FeatureFreePro
Live monitoring & menu bar✓✓
Health score✓✓
Top CPU / memory processes✓✓
Today's slowdown count✓✓
Long-range lag timeline—✓
App Family tree grouping—✓
Menu bar multi-metric customization—✓
One-click app switch & Finder reveal—✓
HTML report export—✓

One-time purchase, lifetime license

Black Friday · 50% off both plans worldwide. Ends November 30, 11:59 p.m. Pacific. Discount applied automatically at checkout.

Local prices and applicable taxes are shown at checkout.

Single

$9.99 · −50% one-time
  • Up to 2 Macs
  • All Pro features
  • 7-day refund

Family

$14.99 · −50% one-time
  • Up to 5 Macs
  • All Pro features
  • For your household

License key · Support

7-day no-questions-asked refund. See the Refund Policy.

Runs locally. Uploads nothing.

Metrics stay on your Mac

CPU, memory, process and timeline data stay on your Mac and are never uploaded. Timeline history is retained locally from the start of recording.

No account, no tracking

No sign-up needed. Neither the app nor this website contains ads, analytics or tracking code.

Minimal license checks

Only Pro activation and periodic re-checks send the license key, a random install ID and the app version. See the Privacy Policy.

FAQ

Which Macs are supported?

A Mac with Apple Silicon (M-series chip) running macOS 13 Ventura or later. Intel Macs are not supported at this time.

Download and install

Download the signed, notarized DMG, open it, and drag MacPulse into Applications. The first launch starts a 7-day Pro trial.

How does activation work?

After purchase you receive a license key to paste into the app. Single activates 2 Macs, Family 5; deactivate an old Mac to move its slot to a new one.

Does it work offline?

Yes. Monitoring works fully offline; Pro keeps working for 7 days after each online check.

Can I get a refund?

Yes — a full refund within 7 days of purchase, no questions asked. The license is then deactivated and free features keep working. See the Refund Policy.

Does it use a lot of resources?

No. It samples system counters every few seconds and stays in the menu bar when the main window is closed, with low overhead.